Navigating Adoption: Tracking With Supernova and Google Analytics
Learn how to measure design system adoption with Supernova and Google Analytics in the fourth article of our Navigating Adoption series. Track key metrics such as traffic, engagement, and more.
Nezar Mansour
,
Content Writer
Aug 19, 2023
Adoption
People are the lifeblood of design systems, and in this series of blog posts, we plan to explore that relationship. We'll focus on design system adoption, its fundamentals, the challenges teams face, how to overcome them, and how to measure success.
Design system documentation sites serve as the user interface between your design system and your users. In our previous article, we went into detail on the different ways you can measure design system adoption. In this article, we’ll go into more detail about how you can measure adoption with Supernova and Google Analytics. We'll explore critical metrics to track design system adoption through documentation usage and how to integrate Google Analytics (GA) with Supernova to gather insights on how your documentation is being used.
Key metrics to track adoption through documentation usage
Before we get into Supernova and GA, let's review the different metrics we should look at with documentation usage.
Documentation Site Traffic: Monitoring overall traffic to your design system documentation helps you understand the reach of your design system and identify trends in usage.
Most Visited Component Pages: Tracking the most visited component pages indicates which components or guidelines are most relevant to users, helping you prioritize updates and improvements.
Time on Page: This metric measures the average time users spend on your documentation pages. A higher on-page time suggests that users are engaged with your content and find it valuable.
Before opening up Google Analytics and seeing how to track these metrics, let's first open up Supernova and prep our documentation. Feel free to skip the next section if you're already familiar with Supernova's documentation.
Setting up your documentation with Supernova
Getting your documentation site up and running and populated with your design system is complex. But now, with Supernova, you can cut down on the time, cost, and difficulty needed to go live. All you have to do is sign up for Supernova to get started.
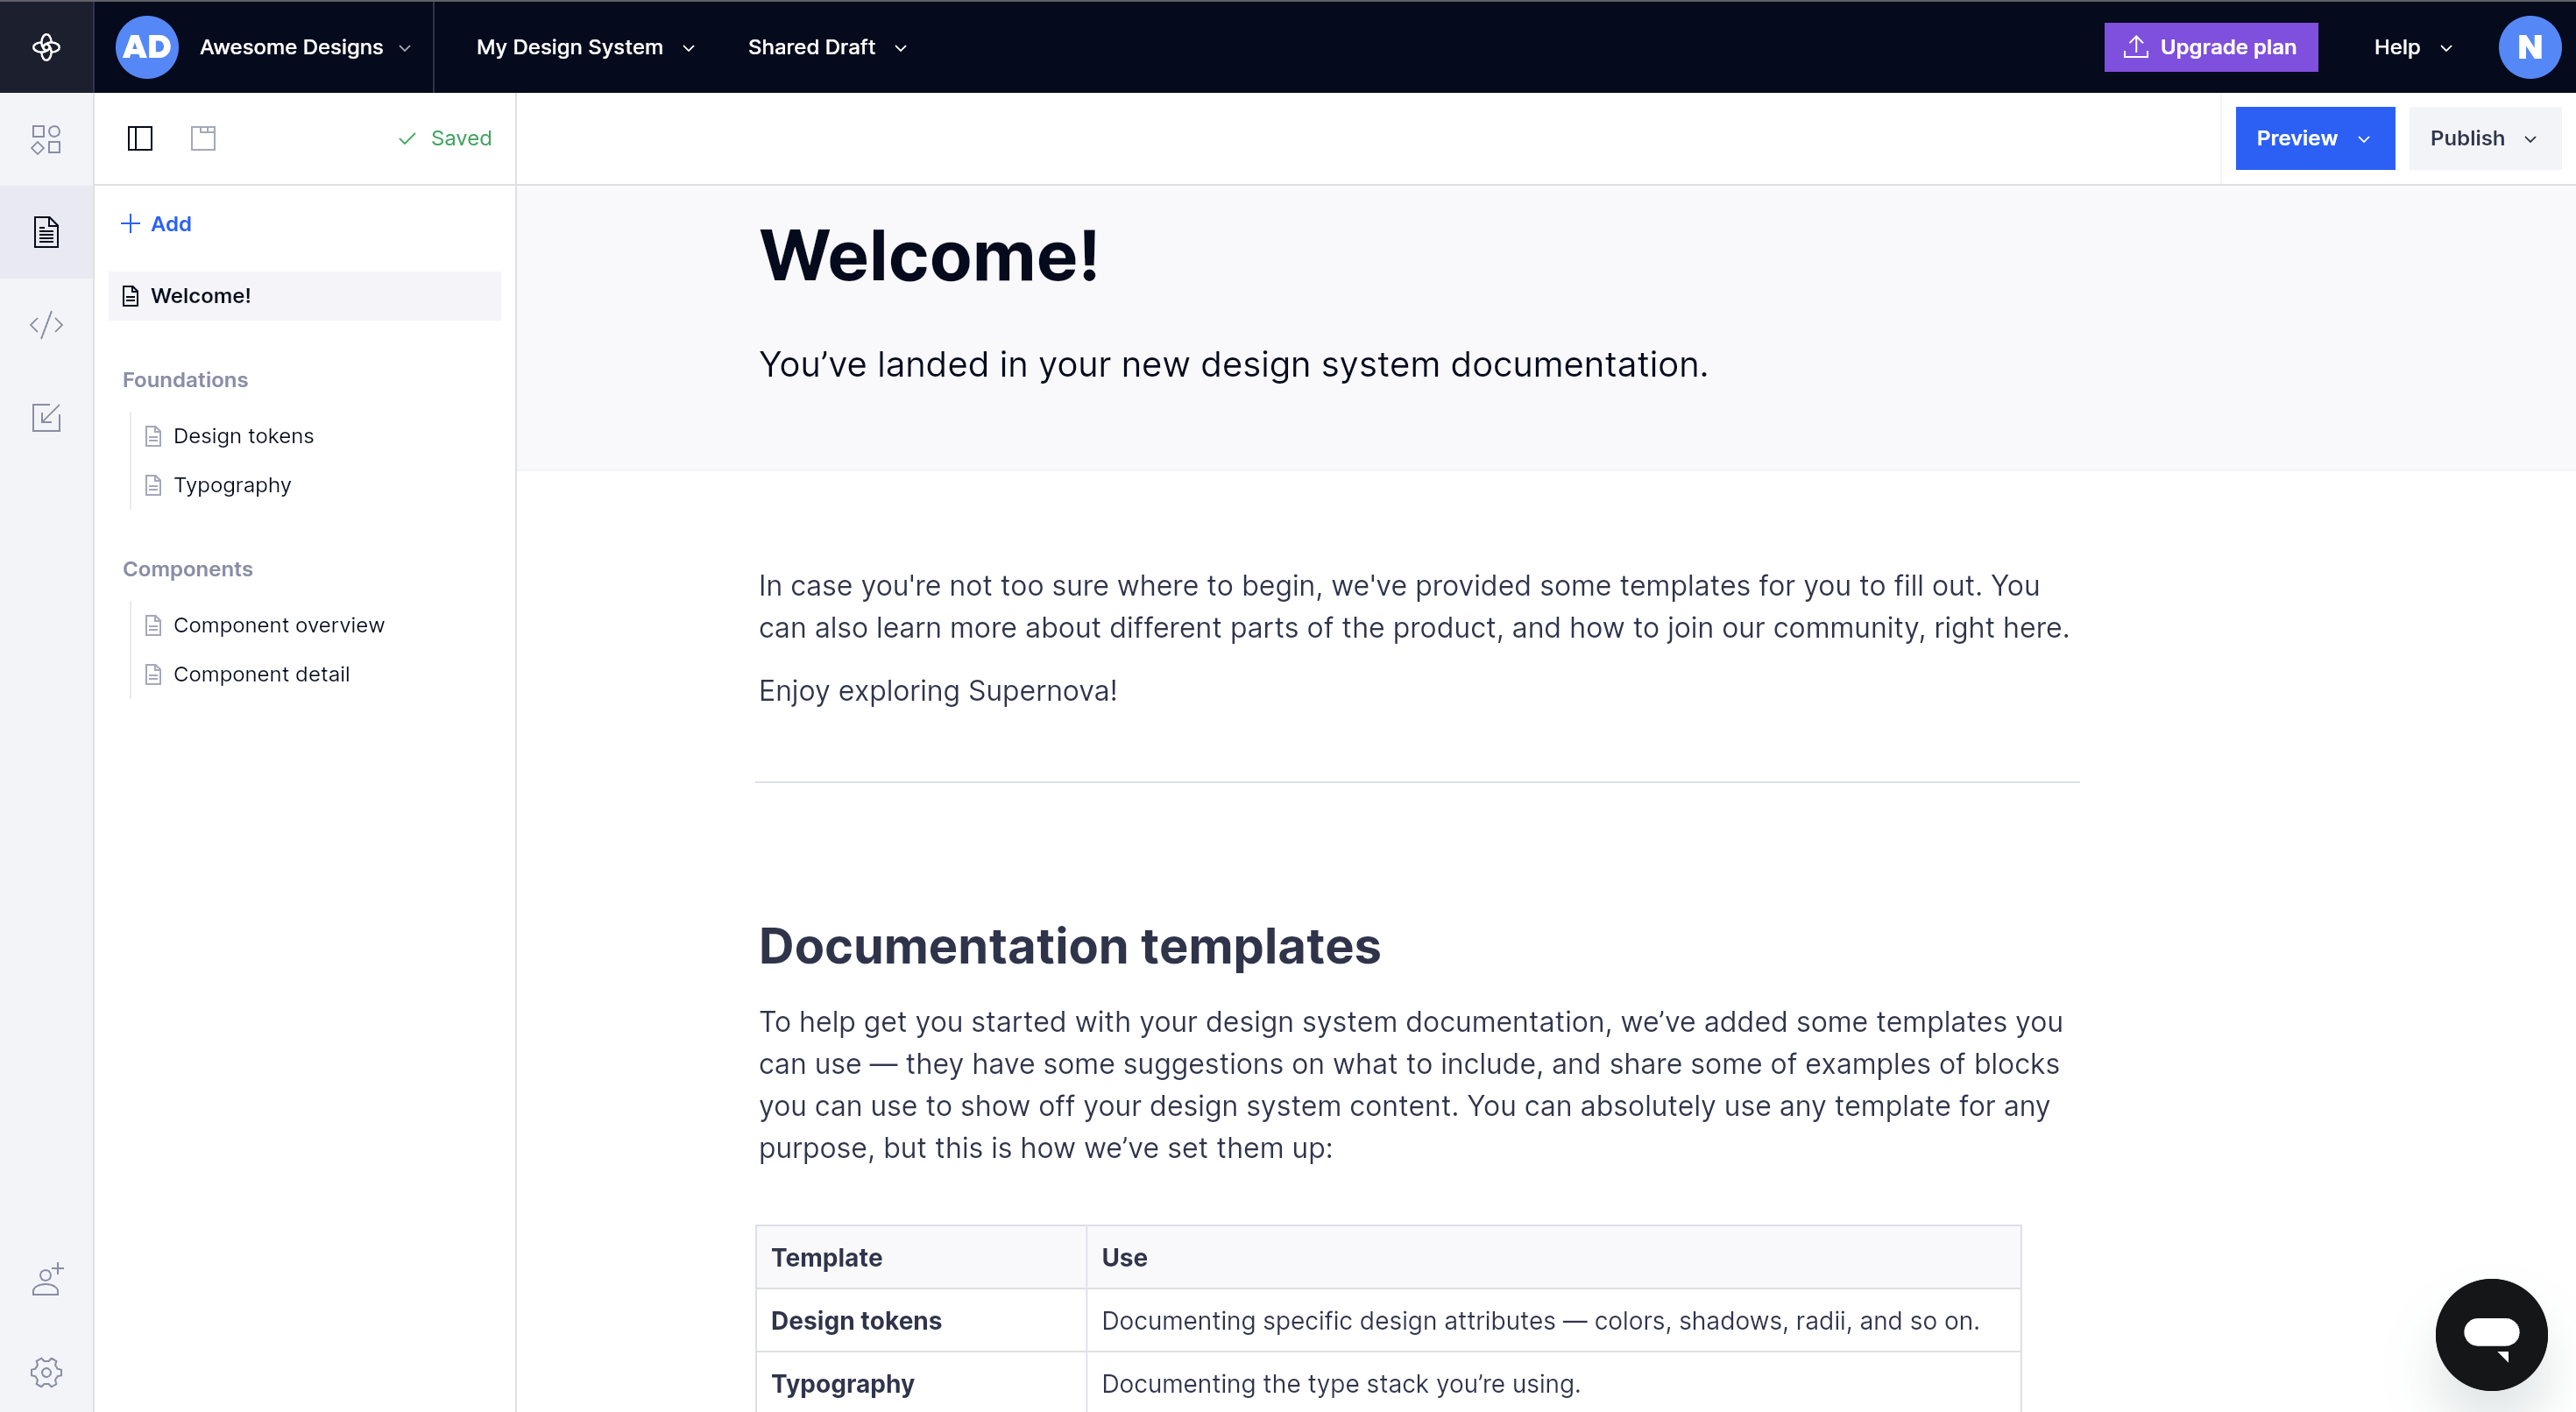
Once you're logged in and have your design system open, you'll be met with the documentation page.
Here you'll find a default layout you can start building your documentation site. Like any text editor, you can add and fill pages as needed.
To start adding your design elements, sync your Figma library to Supernova by adding a data source.
After completing your documentation, click Publish in the top right-hand corner, and your documentation site should be ready. Check out our blog for a more in-depth guide on documenting your design system with Supernova.
Integrating Google Analytics with Supernova
With our documentation now set up, we want to integrate GA (Google Analytics) with Supernova. Follow these few simple steps to add Google Analytics integration:
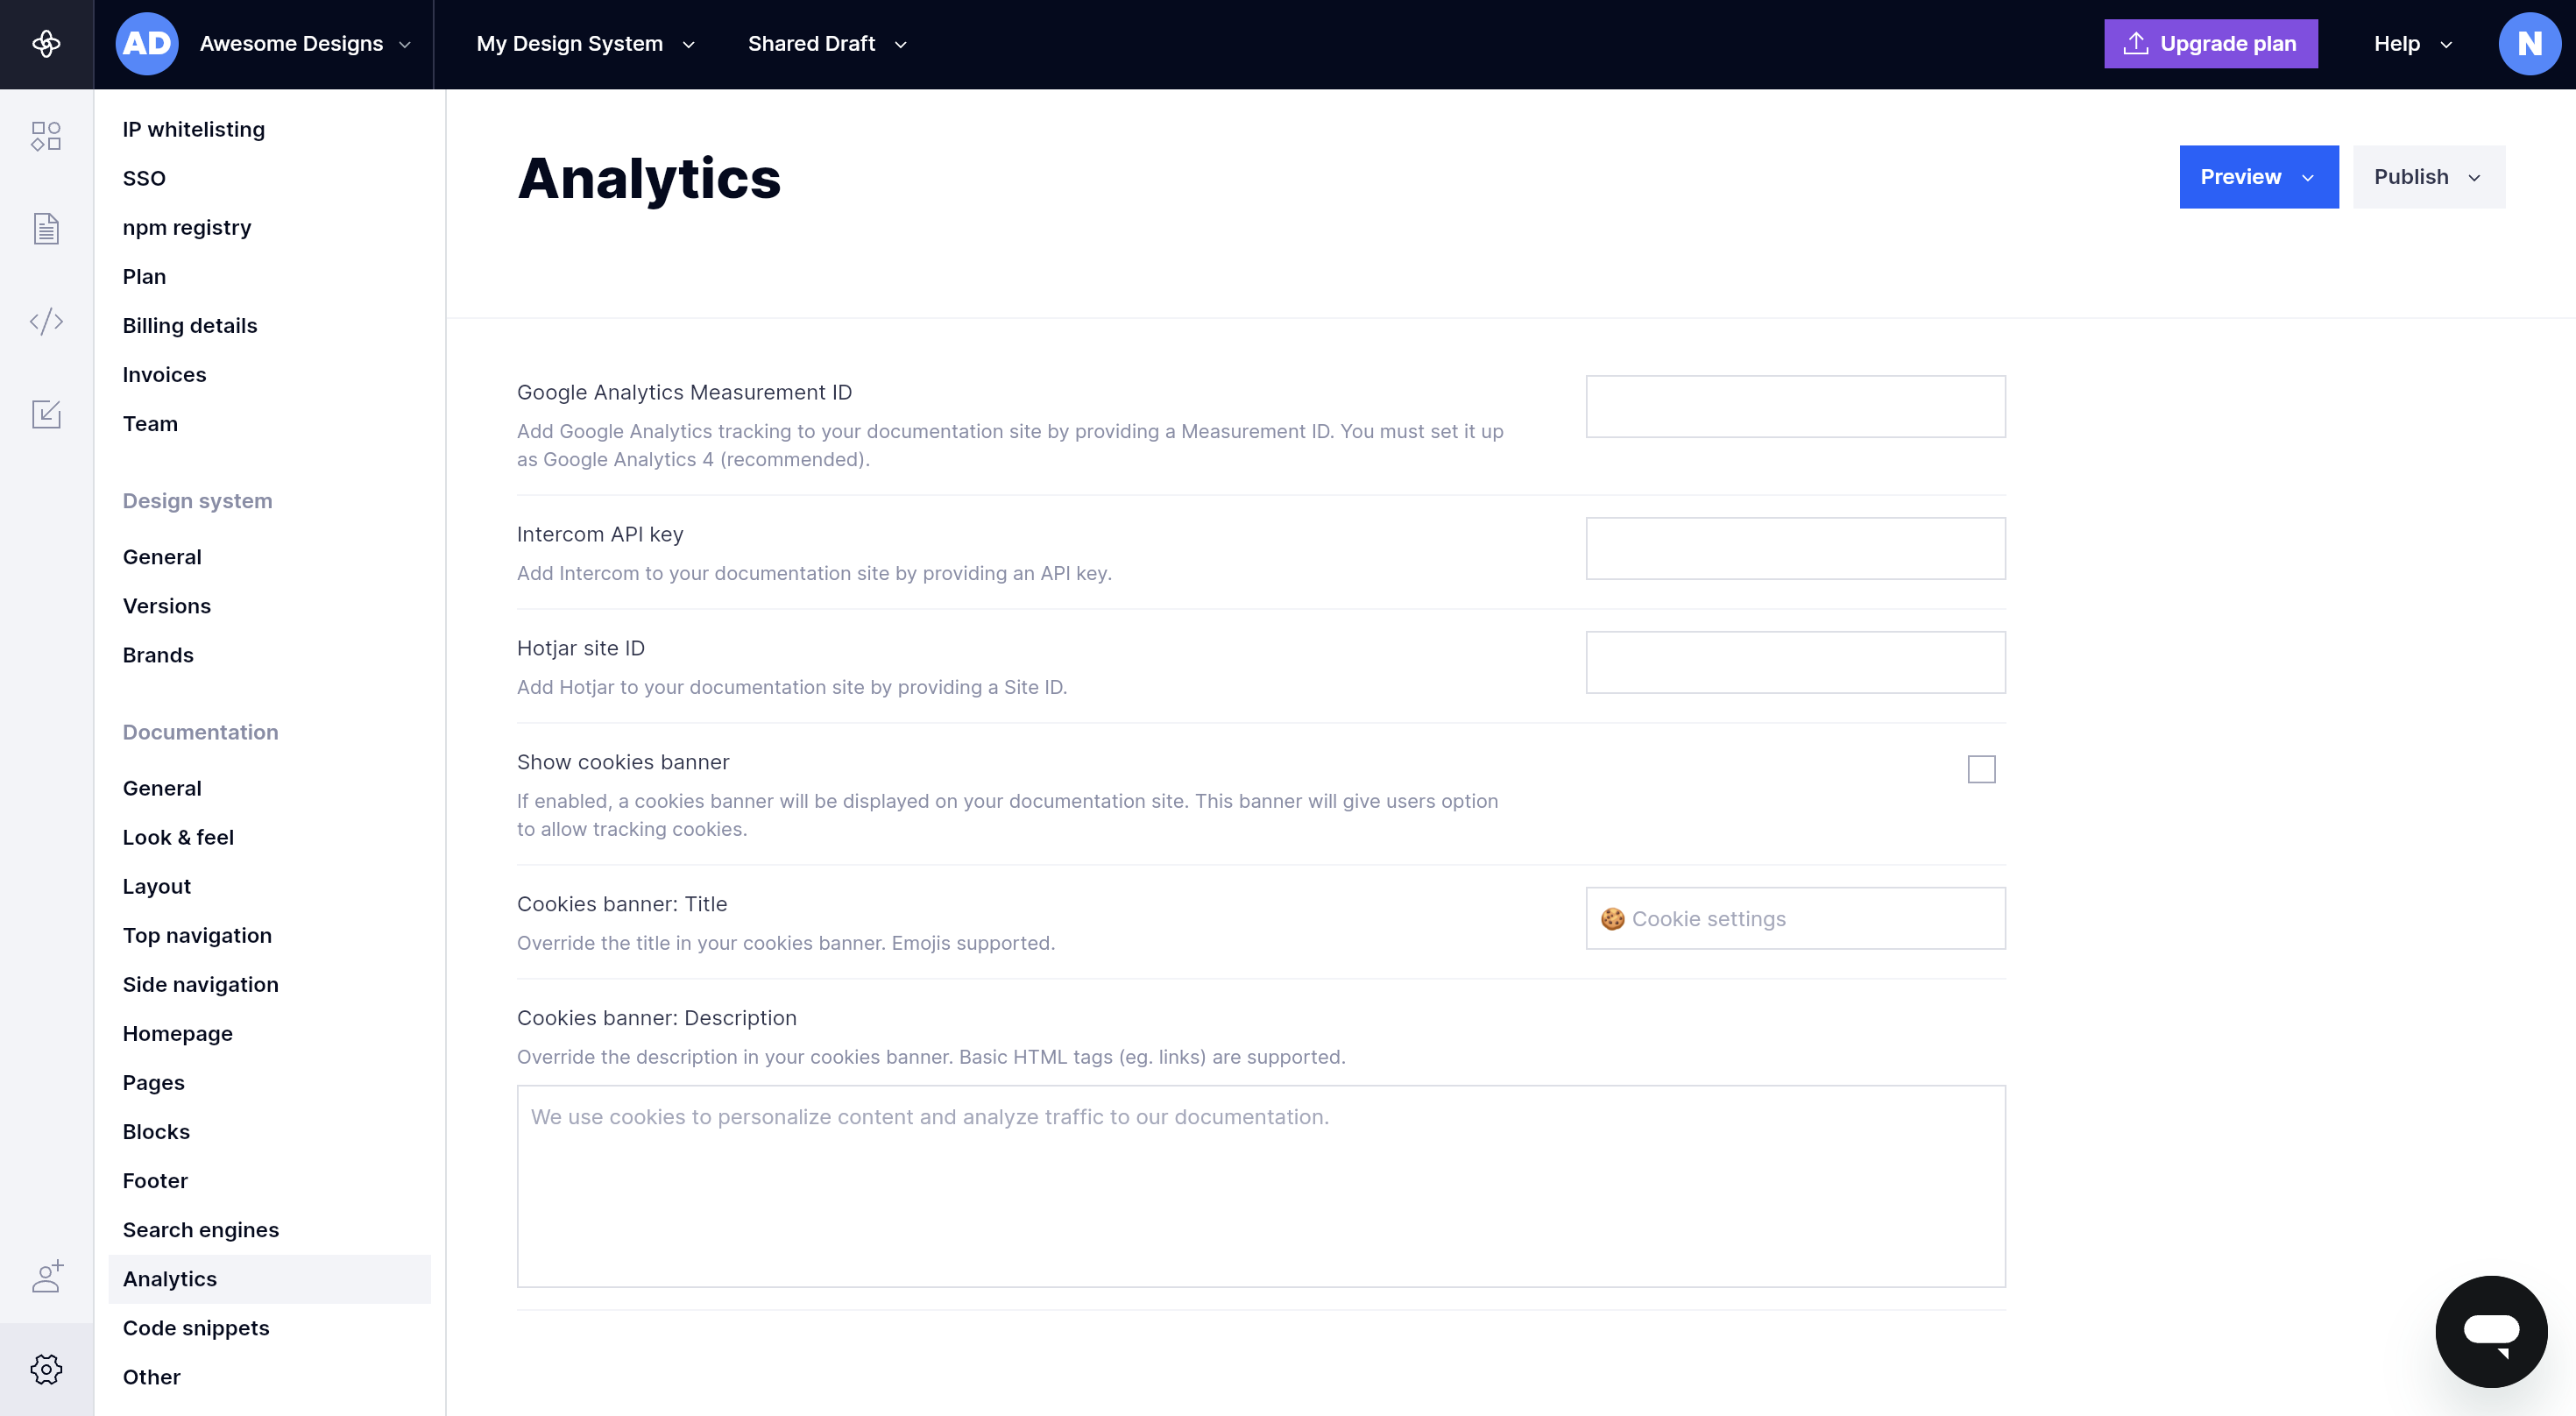
In your Supernova Documentation Settings, click on "Analytics."
Provide your GA4 Measurement ID (e.g., G-XXXXXXX). If you're using Universal Analytics, provide your Tracking ID (e.g., UA-1234567).
Publish your documentation to see activity appear in your Google Analytics dashboard.
Now we should have GA up and running and recording traffic to your documentation site. We can now switch over to GA4 and see which metrics to track.
Tracking adoption in Google Analytics
Google Analytics tracks a large number of metrics, and only some of them will be relevant to us in tracking adoption and documentation usage. Here is a list of important metrics to track in GA:
Users — The total number of unique users that visited your documentation site.
New users — The new unique users that visited your site for the first time.
Sessions — The period during which a user was engaged on your site.
Average session duration — The average time users spent on your site during a session.
Engaged session per user — The number of engaged sessions for each user. This gives you an insight into how popular certain pages are.
Engagement rate — The rate of engaged sessions, which are sessions that last more than 10 seconds or view multiple pages.
Views — The total number of times a page was viewed by users.
Views per user — Rate of page views per user.
Views per session — Rate of page views for each session.
You can create reports tracking different sets of metrics to focus on different aspects of engagement. Here's an example of the final report for a Supernova documentation site featuring our design system — Dark Matter.
Make sure you leverage the date range for reports to generate relevant data and also to compare to see growth over time.
With our Supernova documentation up and running and integrated with Google Analytics, the numbers will start piling in. It may take a while for enough data to be recorded so you can make judgments on how successful adoption is. That shouldn't stop you from gathering more user-reported metrics or optimizing for adoption. Catering your design system for both designers and developers can be tricky, but we've got you covered. For our last article of the series, we'll dive into developer adoption and how to get them on board.
Subscribe
Stay updated on Supernova and the best design system best practices.
The age of the builder is upon us. Get ready for what lies ahead.

.png)