The Best Examples of Data Visualization in 11 Leading Design Systems
Explore how the top design systems use data visualization to create clear, accessible, and actionable insights. Learn key features and best practices for effective data presentation.
Nezar Mansour
,
Content Writer
Oct 8, 2024
Foundations
In a world driven by data, the ability to present information clearly and effectively is more critical than ever. For many companies, this challenge is solved through data visualizations embedded in their digital products. However, achieving consistency, accessibility, and usability across various platforms is no small feat, especially when it comes to visualizing complex data.
This is where design systems come into play, offering a unified framework that governs not only the visual style but also the interaction and behavior of data visualizations. Whether it’s color palettes for charts, choosing the right graph types, or ensuring accessibility for all users, these systems have refined their approaches to make data both beautiful and actionable.
Below, we explore some of the best examples of data visualization practices within the most advanced design systems today, showcasing live examples where possible to highlight their impact on user experience. We chose these companies as references because they regularly handle large volumes of data, making their data visualization practices critical to their products' success.
Visma’s Unified Design (VUD) system
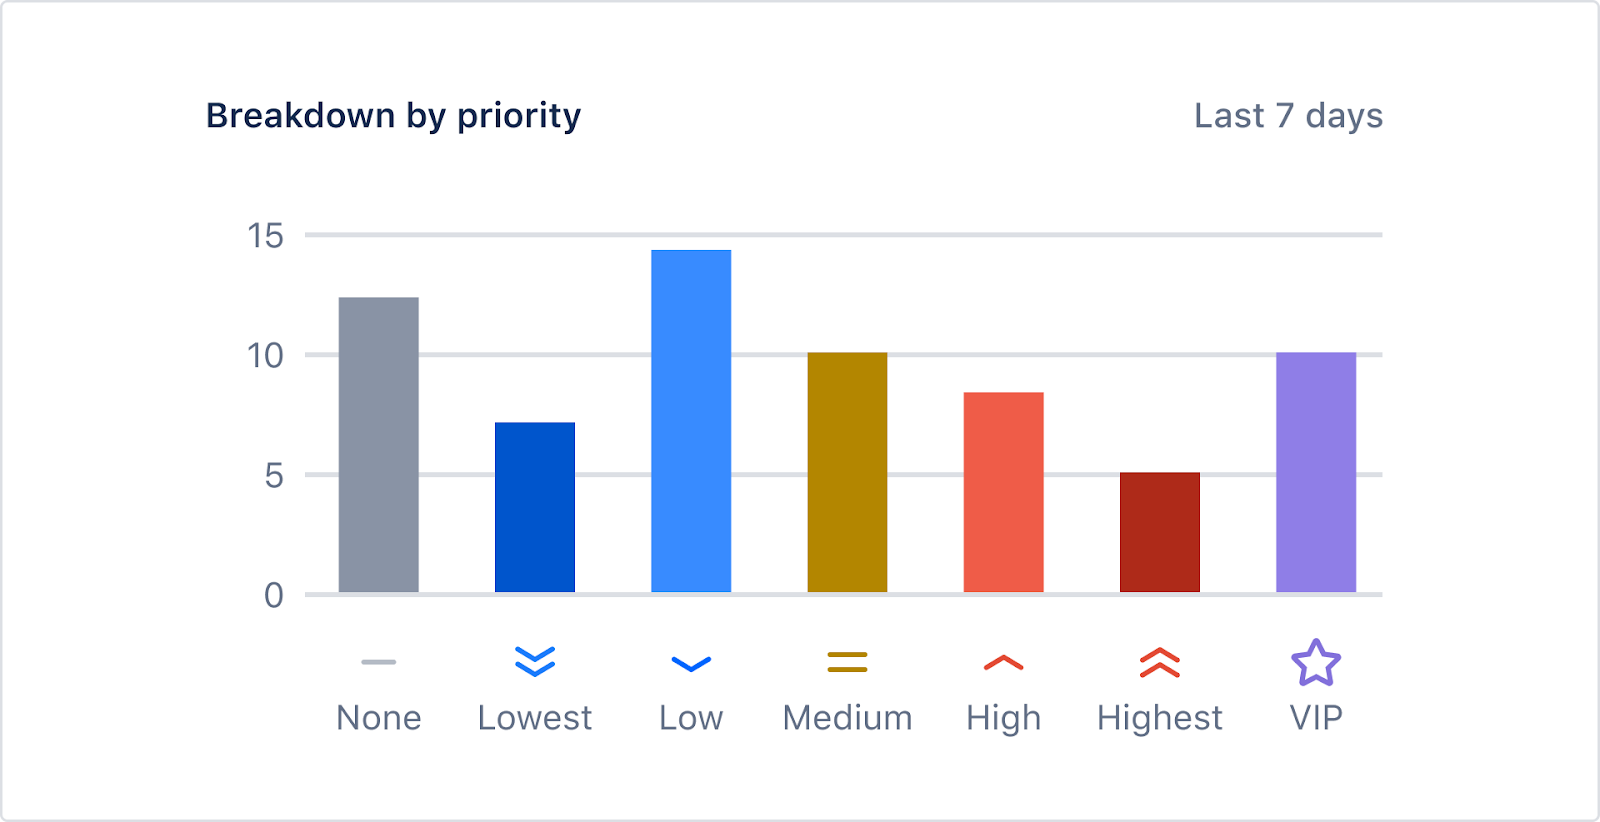
Visma’s Unified Design (VUD) system serves a suite of enterprise products that rely heavily on data visualizations to communicate critical information, such as financial reports and performance analytics. As a provider of software solutions for industries like accounting, payroll, and procurement, Visma’s design system focuses on helping users make informed decisions by presenting complex data in a clear, accessible way.
Key features:
Limited number of colors: Visma emphasizes the use of fewer colors to ensure visualizations are accessible and easy to interpret, preventing unnecessary complexity.
Differentiated by shapes and lines: By varying shapes, line thicknesses, and other visual elements in charts, Visma improves clarity, especially for users with visual impairments.
Interactive visual feedback: Interactive visual feedback ensures that users can easily engage with the data, helping them understand and act on the information presented.
As a company focused on monitoring and analyzing massive amounts of data in real time, Datadog’s data visualizations are at the core of its platform. Their DRUIDS design system provides flexible and customizable components that empower users to monitor system performance, security metrics, and logs in real time. With data playing a central role in Datadog’s offerings, their visualizations are critical to helping users make fast, informed decisions.
Key features:
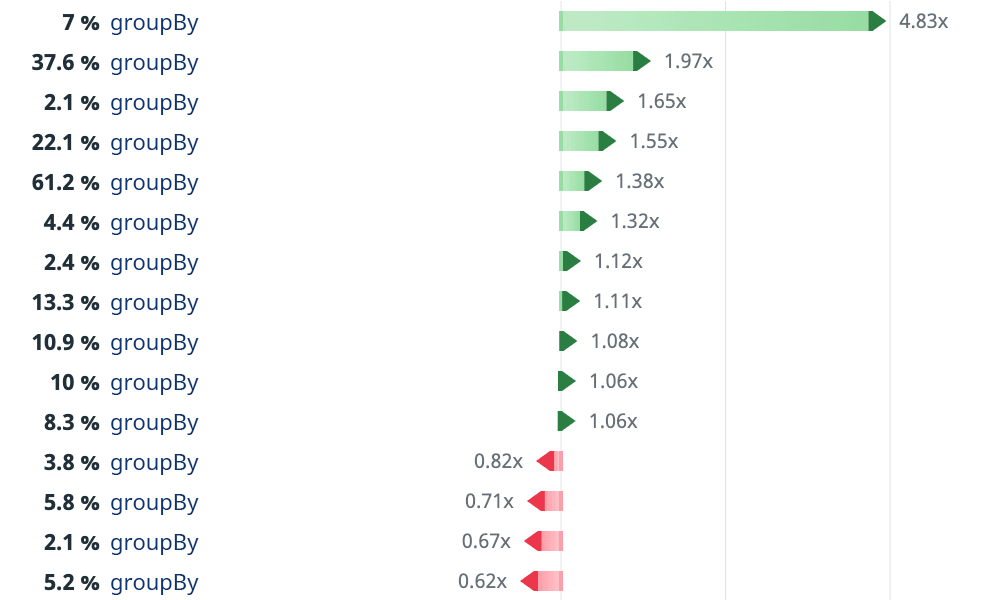
Change graphs: Datadog’s design system includes highly flexible change graphs, which highlight changes between two values with color-coded backgrounds. This is especially useful for tracking real-time data changes.
Heatmaps and timeseries: To handle large datasets and time-based metrics, Datadog provides heatmaps and customizable timeseries charts, allowing users to visualize data trends and relationships over time.
Topology maps: For network and system monitoring, Datadog includes topology maps that visualize relationships between nodes, helping users understand complex data connections at a glance.
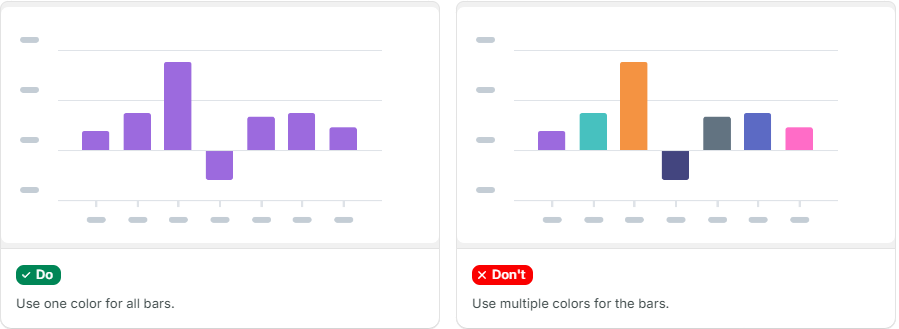
Atlassian is known for its tools like Jira and Confluence, which generate vast amounts of data that teams rely on to manage tasks and workflows. The Atlassian design system provides detailed guidance on how to use color in data visualizations, ensuring that complex information is easy to interpret and accessible to all users.
Key features:
Single-color charts: For simplicity and clarity, Atlassian recommends using a single brand color with neutral tones, making important data stand out.
Categorical colors: For different data categories, Atlassian allows up to five or six distinct colors, ensuring readability while maintaining clarity.
Status and severity: Colors are also used to convey status (success, warning, danger), but Atlassian ensures that these are complemented by other visual indicators to enhance accessibility.
Atlassian’s data visualization guidelines
IBM’s Carbon design system
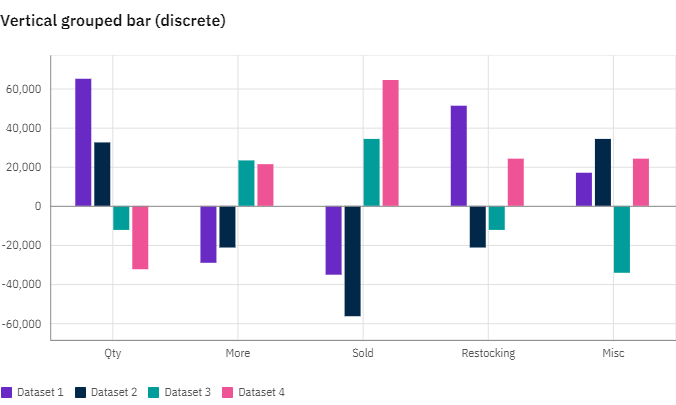
IBM’s Carbon Design System offers a wide range of charts, each suited for specific types of data analysis. This design system is particularly useful for teams dealing with various data visualization needs, from comparing data to analyzing trends. Carbon excels at offering diverse chart types based on different data-driven scenarios, making it a strong reference for businesses managing a large amount of data.
Key features:
Extensive web platform support: Carbon’s data visualizations support vanilla JavaScript, Svelte, React, Vue and Angular.
Heavily customizable charts: Chart components are highly customizable with advanced functionality such as themes, dual axes, color palettes, combo charts, and event handling.
Establishes a strong hierarchy: Carbon encourages users to apply a strong hierarchy when it comes to dashboards–prioritizing data by importance.
IBM Carbon’s data visualization guidelines
Mailchimp’s Pattern Library
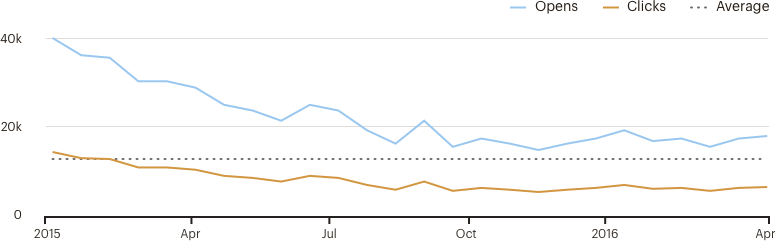
Mailchimp’s platform is deeply rooted in marketing analytics, where the clear presentation of engagement and audience metrics is critical for its users. Mailchimp's pattern library provides precise guidance for designing simple, yet effective, data visualizations that are focused on helping users make quick, informed decisions.
Key features:
Clear charts: Mailchimp avoids decorative elements, keeping charts clean and to the point. line charts feature solid lines for actual data, with dotted lines for averages or projections, ensuring clarity.
Predefined color palettes: Predefined color combinations are used to maintain visual harmony and accessibility. Mailchimp prioritizes contrast and hue variety to ensure charts are readable.
Avoid pie charts: Mailchimp advises against pie charts, suggesting percent bar graphs for improved data comprehension.
Shopify’s Polaris Design System provides comprehensive guidelines for data visualizations that focus on clarity and answering specific business questions. With e-commerce at its core, Shopify’s users interact with a lot of data related to sales, customer behavior, and inventory, making their design system’s data visualizations essential for day-to-day decision-making.
Key features:
Focused on a single question: Each visualization should answer a specific question, such as “What are my sales over time?” This keeps the visualizations simple and focused.
Uses five core traits: Shopify emphasizes accuracy, intuitiveness, engagement, focus, and granularity in their data visualizations, ensuring that users get the insights they need at a glance.
Axis and labeling guidelines: Axis lines and labels are designed for clarity without clutter, and color is used thoughtfully to enhance accessibility.
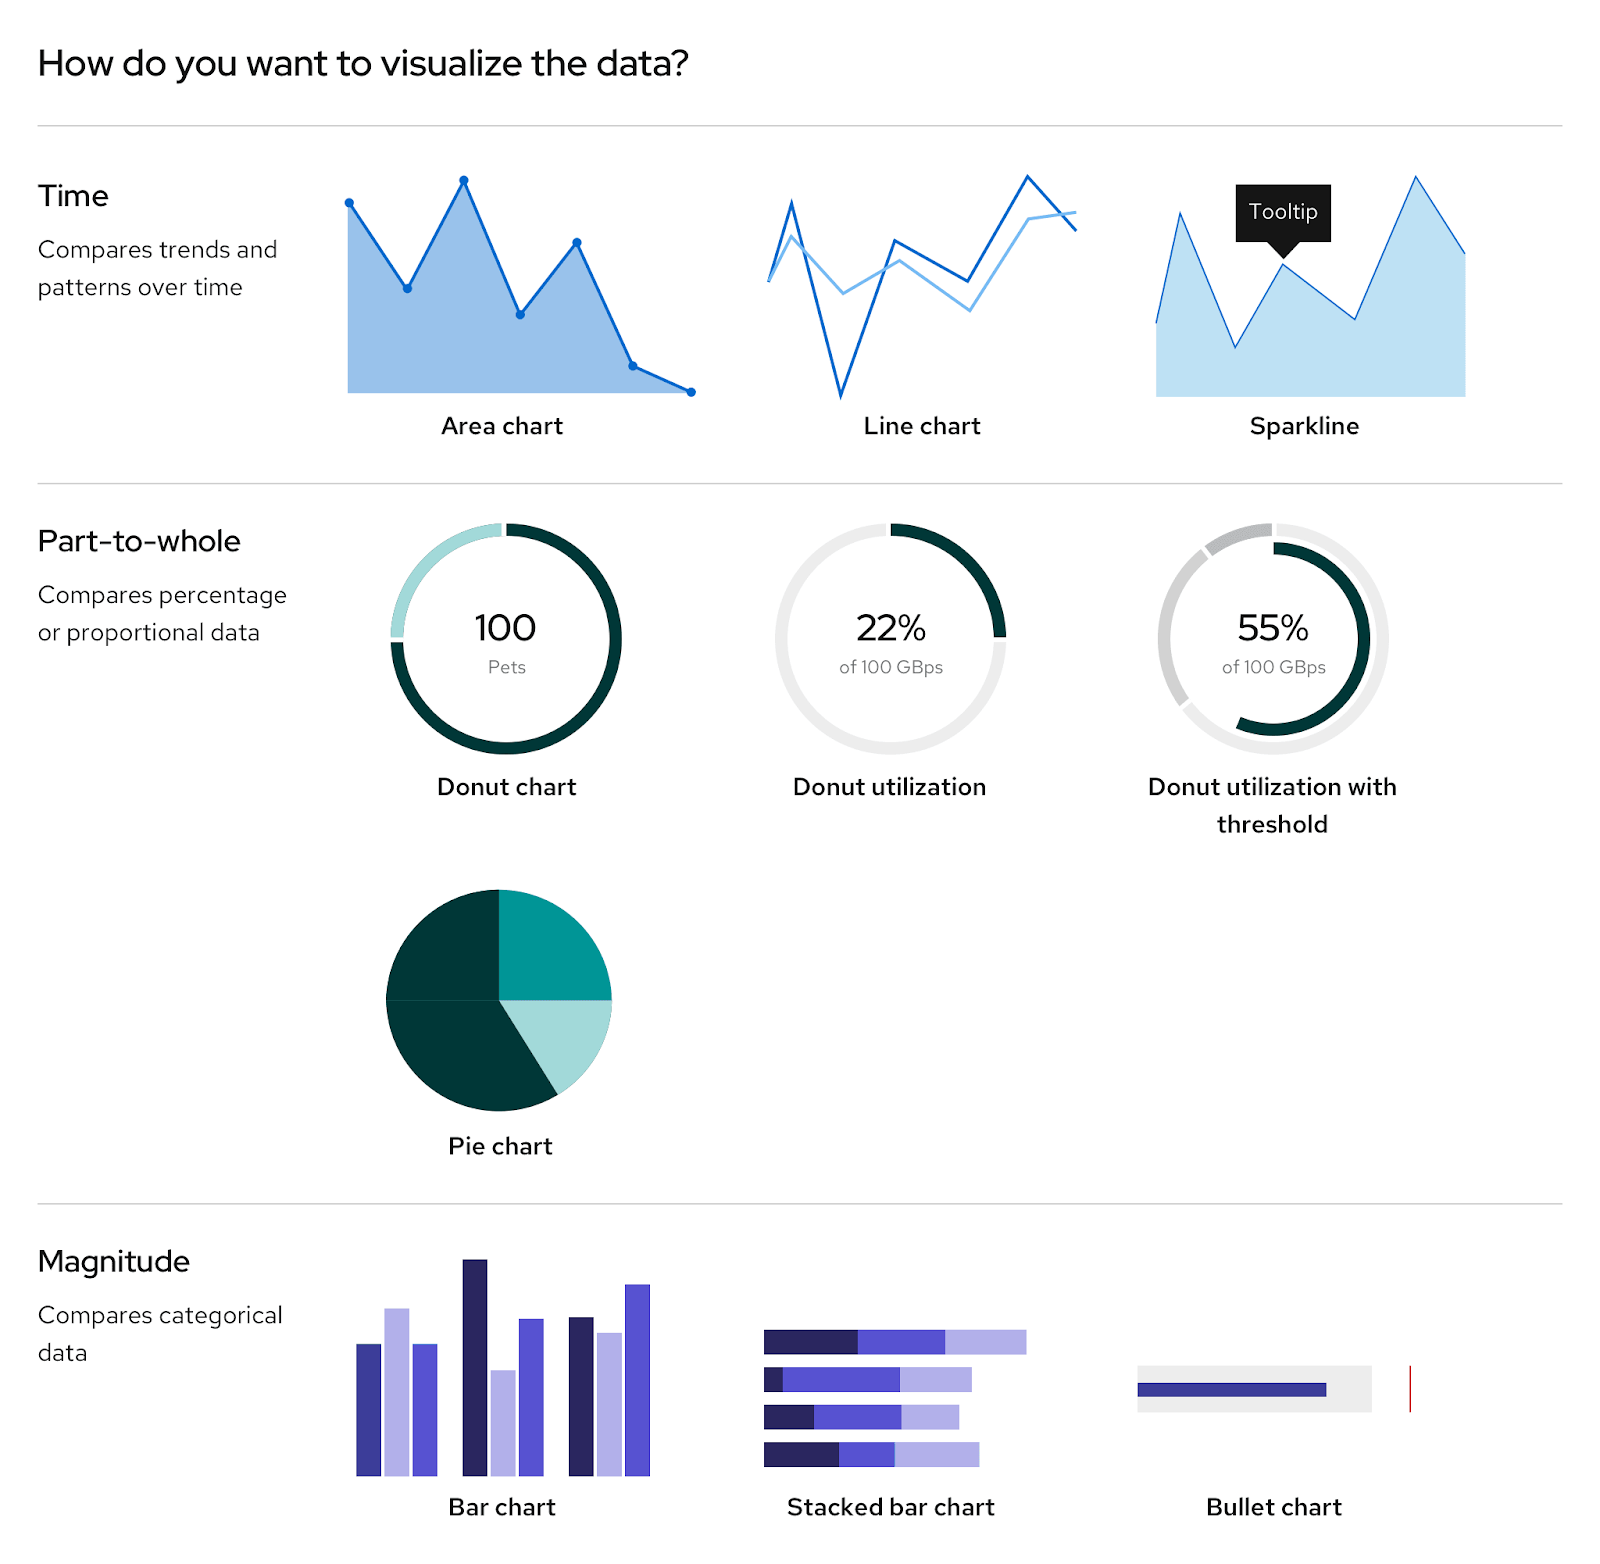
Red Hat’s open source design system PatternFly is used for enterprise applications that require highly functional and flexible data visualizations. It offers an extensive selection of charts and best practices for designing data visualizations that prioritize clarity, usability, and interaction.
Key features:
Chart variety: PatternFly offers a range of chart types including area, bar, line, and pie charts, as well as more specialized charts like bullet and sparkline charts.
Interactive legends: Interactive chart legends allow users to isolate or highlight specific datasets, making large and complex charts more navigable.
Design elements: Consistency in elements like title alignment, tooltips, and legends helps ensure that even complex charts remain user-friendly.
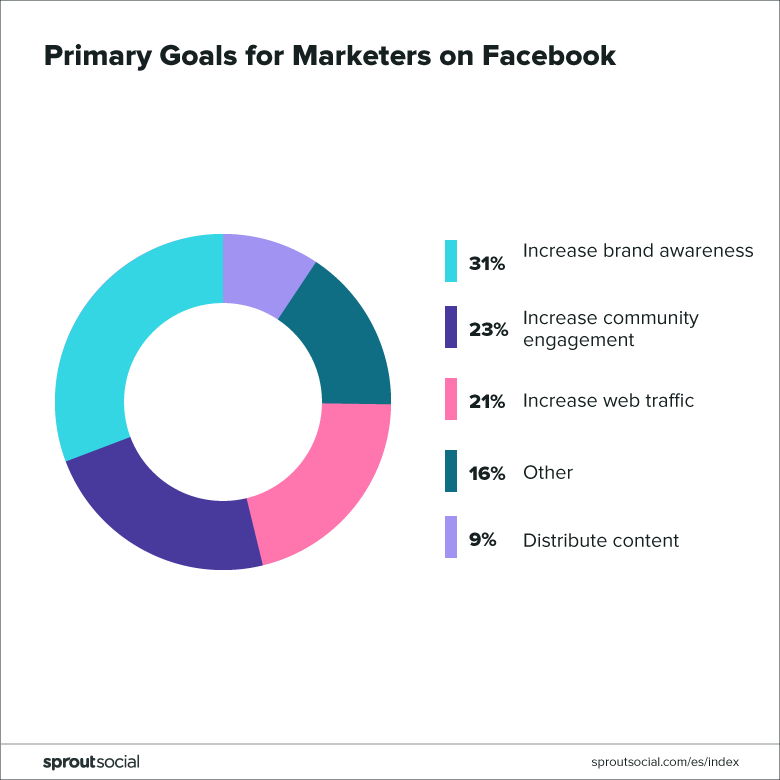
Sprout Social’s platform is centered around social media analytics, where data visualizations play a critical role in helping marketers track engagement and performance metrics. Sprout Social’s Seeds design system provides clear guidelines for creating visualizations that make it easy for users to draw insights from their data.
Key features:
Social media performance tracking: Seeds offers charts specifically designed for tracking audience engagement and campaign performance, focusing on making trends easy to interpret.
Clarity through color: The design system emphasizes the use of color to highlight key data points without overwhelming the user.
Data storytelling: The system encourages the use of visualizations to tell a story, helping users make sense of complex data through clear, concise graphics.
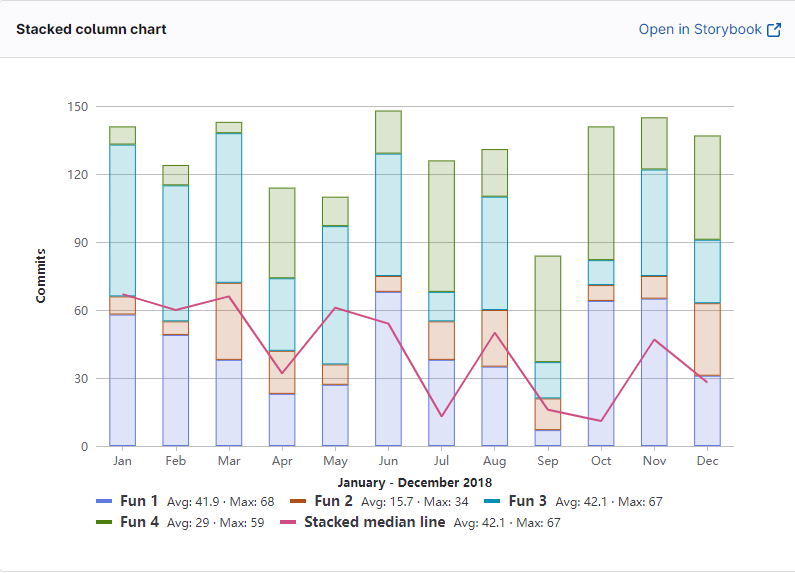
GitLab’s Pajamas Design System provides detailed guidance on how to present data effectively, with a strong focus on turning data into actionable narratives. Given GitLab’s focus on DevOps and collaboration tools, their data visualizations aim to provide clarity and insight for users managing code, tasks, and performance.
Key features:
Cohesion, structure, and readability: Visualizations are designed with clear structures, making them easy to interpret. Cohesion between elements ensures that users can quickly digest complex information.
Prioritizes cognition: Visualizations that align data points on a common scale are favored, as they are easier for users to interpret. The system discourages the use of pie charts, opting for visualizations that provide greater accuracy.
Tailored visualization types: Pajamas breaks down visualizations into categories like hierarchical (treemaps), relational (network diagrams), and temporal (timelines) to match specific use cases.
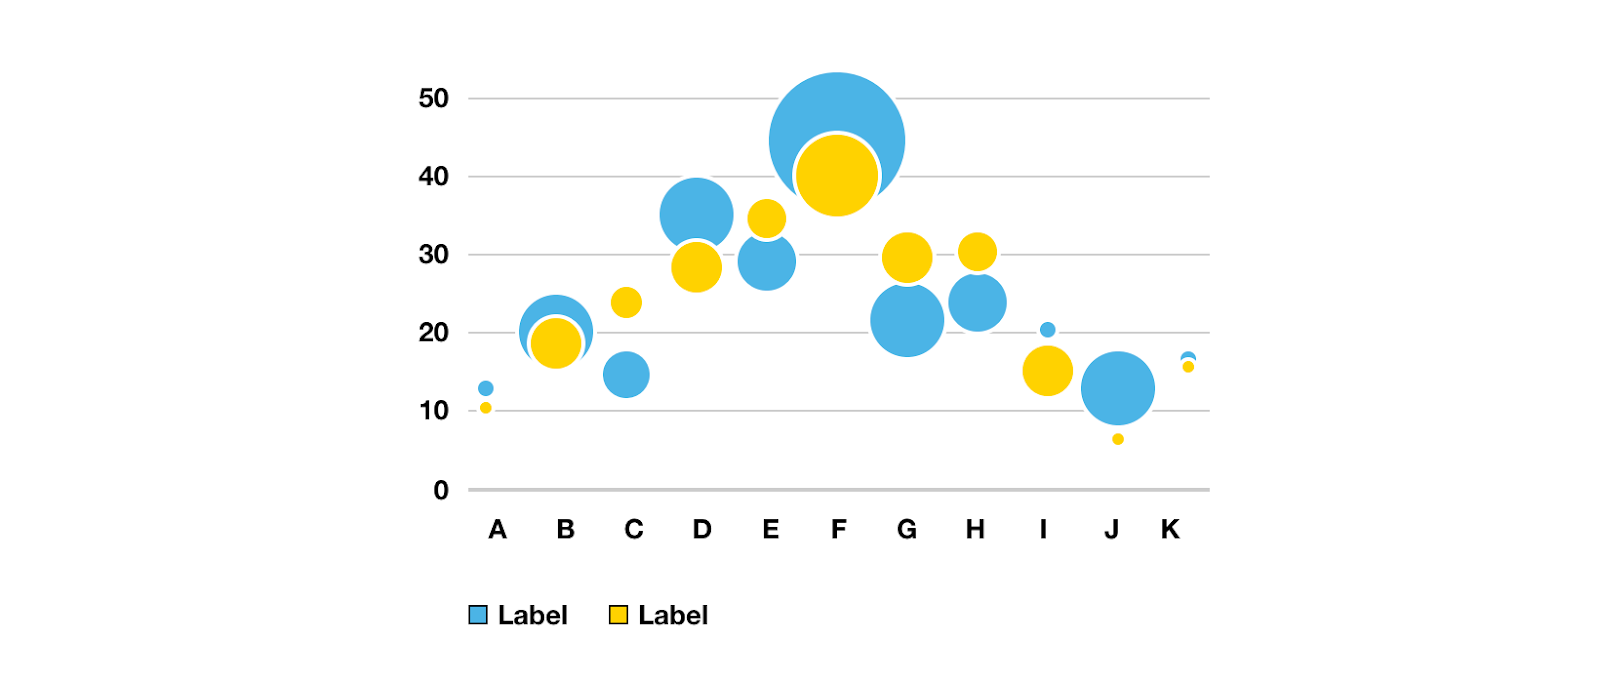
The Orange design system supports the telecommunications giant’s wide range of digital products by providing clear guidelines for data visualization. Given Orange’s focus on communication services and user interaction, their design system emphasizes clarity and accessibility across platforms.
Key features:
Consistency across platforms: Orange’s system uses design tokens and components (for labels, text, and colors) to ensure that data visualizations look consistent across web, iOS, Android, and more, making it easy to scale visuals for different platforms.
Accessibility focus: The guidelines emphasize creating data visualizations that are accessible to all users, incorporating principles like high contrast and simple labeling.
Appropriate chart selection: The system guides users toward choosing the right chart type for the data being displayed, prioritizing ease of understanding.
Twilio’s Paste Design System supports its communication APIs by offering clear guidelines on how to visualize data effectively. With Twilio handling real-time communications and large datasets, the system emphasizes visualizations that are both clear and responsive.
Key features:
Data simplicity: Paste emphasizes simplicity in data visualizations, ensuring that users can quickly understand data points without unnecessary complexity.
Consistency with design language: The system promotes the use of Twilio’s design language to ensure that visualizations feel cohesive across different products.
Customizable components: Twilio’s data visualizations are designed to be highly customizable, allowing teams to tailor visualizations to fit the specific needs of different use cases, such as real-time messaging data or API performance metrics.
These design systems represent the best practices in data visualization, each tailored to the unique needs of their respective industries. Whether it’s real-time monitoring, marketing analytics, or e-commerce data, these companies showcase how thoughtful data visualization enhances the user experience while making data more accessible and actionable.
Subscribe
Stay updated on Supernova and the best design system best practices.
The age of the builder is upon us. Get ready for what lies ahead.


.png)