
Optimizing Design System Usage with Analytics and Metrics
Learn how to measure the adoption of your design system with user-reported metrics and analytics in the third article of the Navigating Adoption series.

Adoption
Learn how to measure the adoption of your design system with user-reported metrics and analytics in the third article of the Navigating Adoption series.
Previously in our adoption series, we've discussed why you should care about adoption, the challenges you'll likely face, and how to overcome them. To better understand how successful you are, we need to learn how to measure adoption to determine success. Once again, we've got you covered!
We've talked to our users and done the research to compile the definitive ways to measure design system metrics and analytics inspired by popular design systems. We'll go over the different kinds of user-reported and analytical metrics, inspiration from successful implementations, and the benefits of each to help you determine what works best for your team.
Design systems are internal products by nature. This makes it easier to get access to rich qualitative feedback from your primary users. It's much easier to schedule a quick catch-up over Slack or get feedback from a survey vs. getting external users to carve out time from their week. So when you're looking to measure how well your design system is doing, it's time to make the most of that access.
From our recent panel discussion on documentation, Alberto Calvo, former Maze Design Operations Manager, shared his approach, “Meeting people where they are [is key]. We have dedicated jam sessions and office hours weekly. We also have monthly design systems meets to communicate and discuss changes with the team, gather ideas, and see what's working and what isn't." You can read more about how you can approach users in our previous blog. But now, let's go over the different methods you can use to get user-reported metrics for your design system adoption.
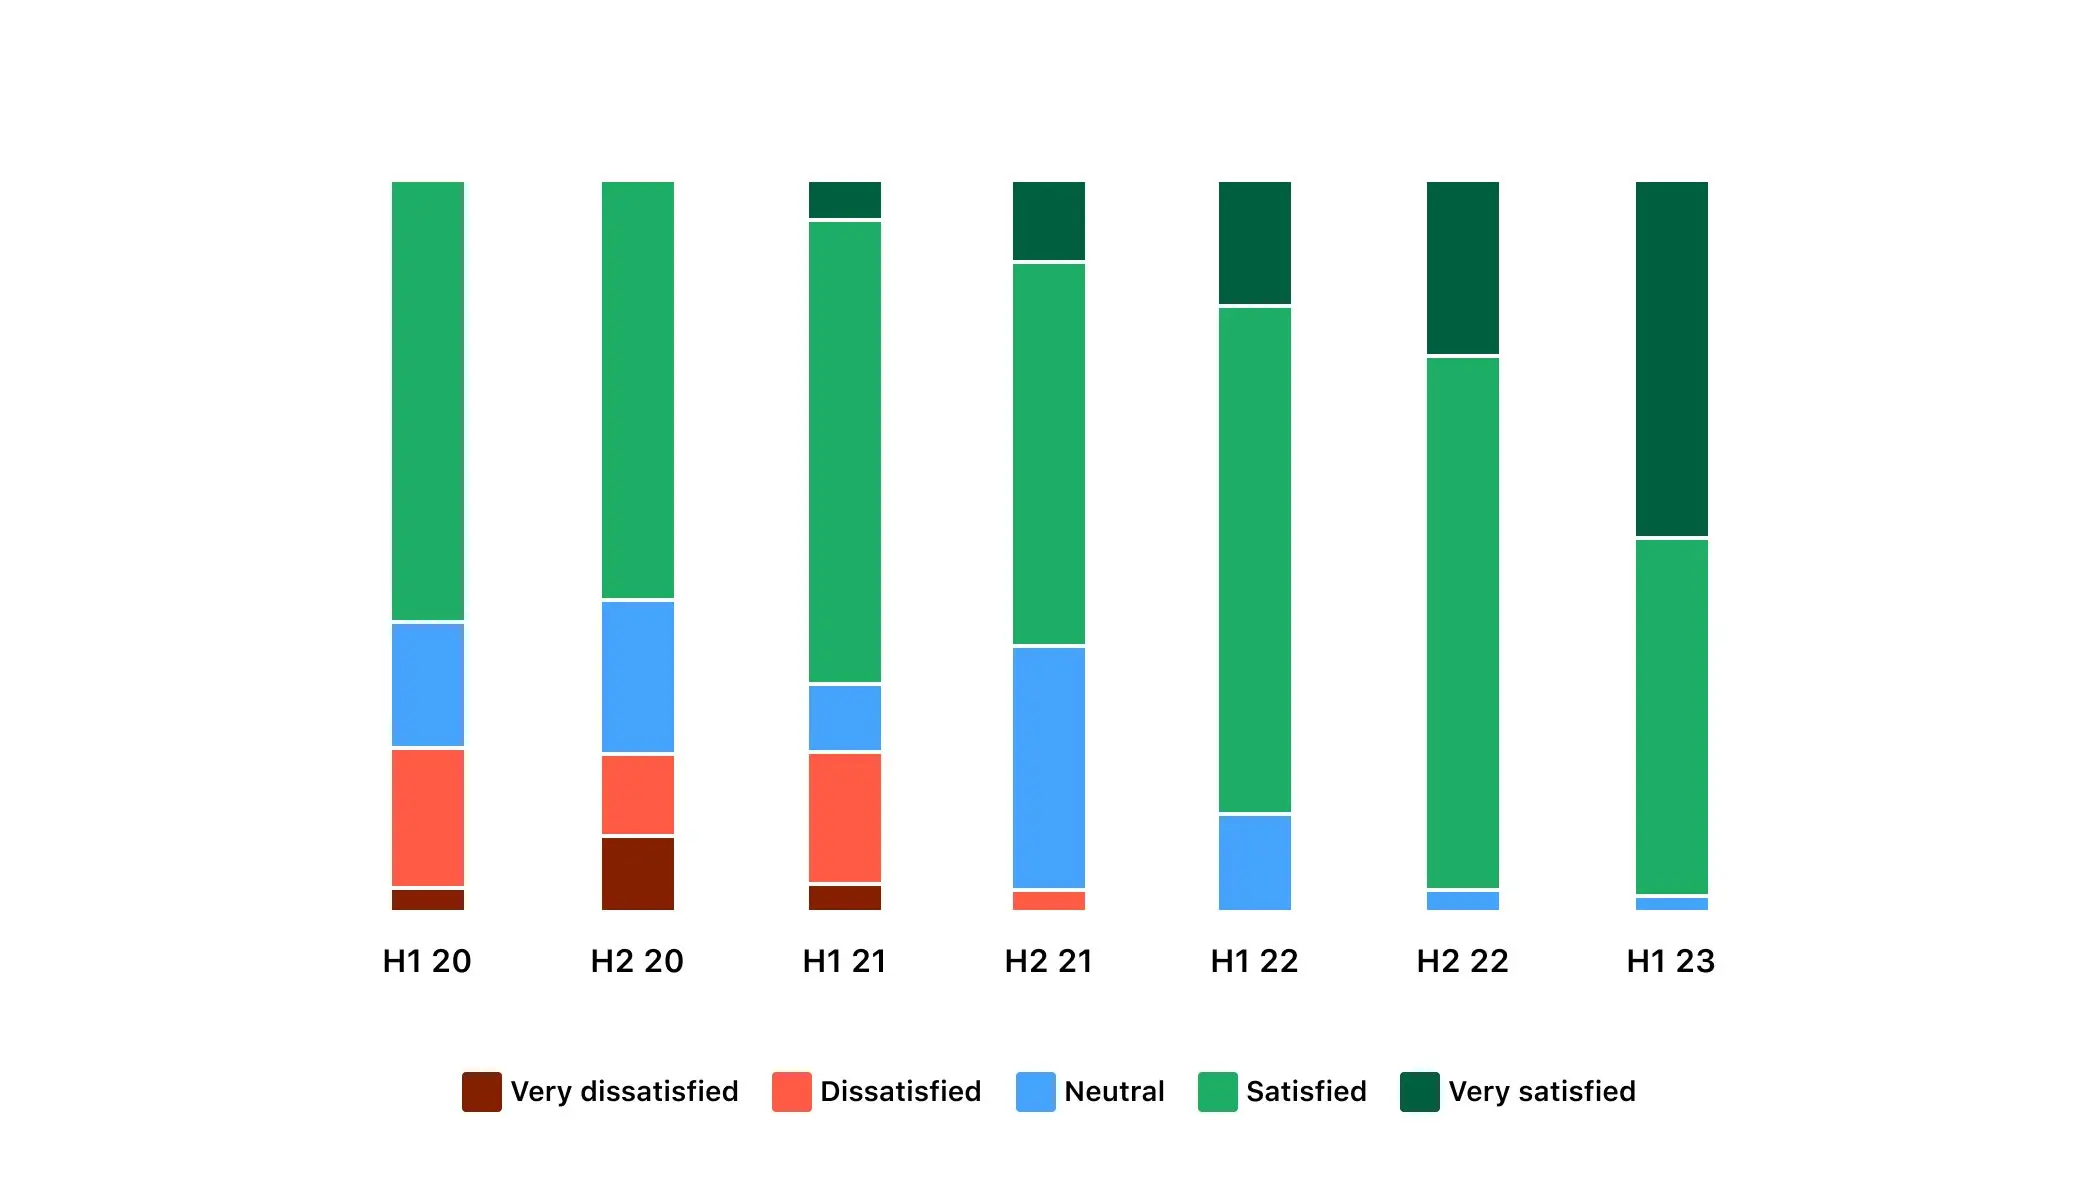
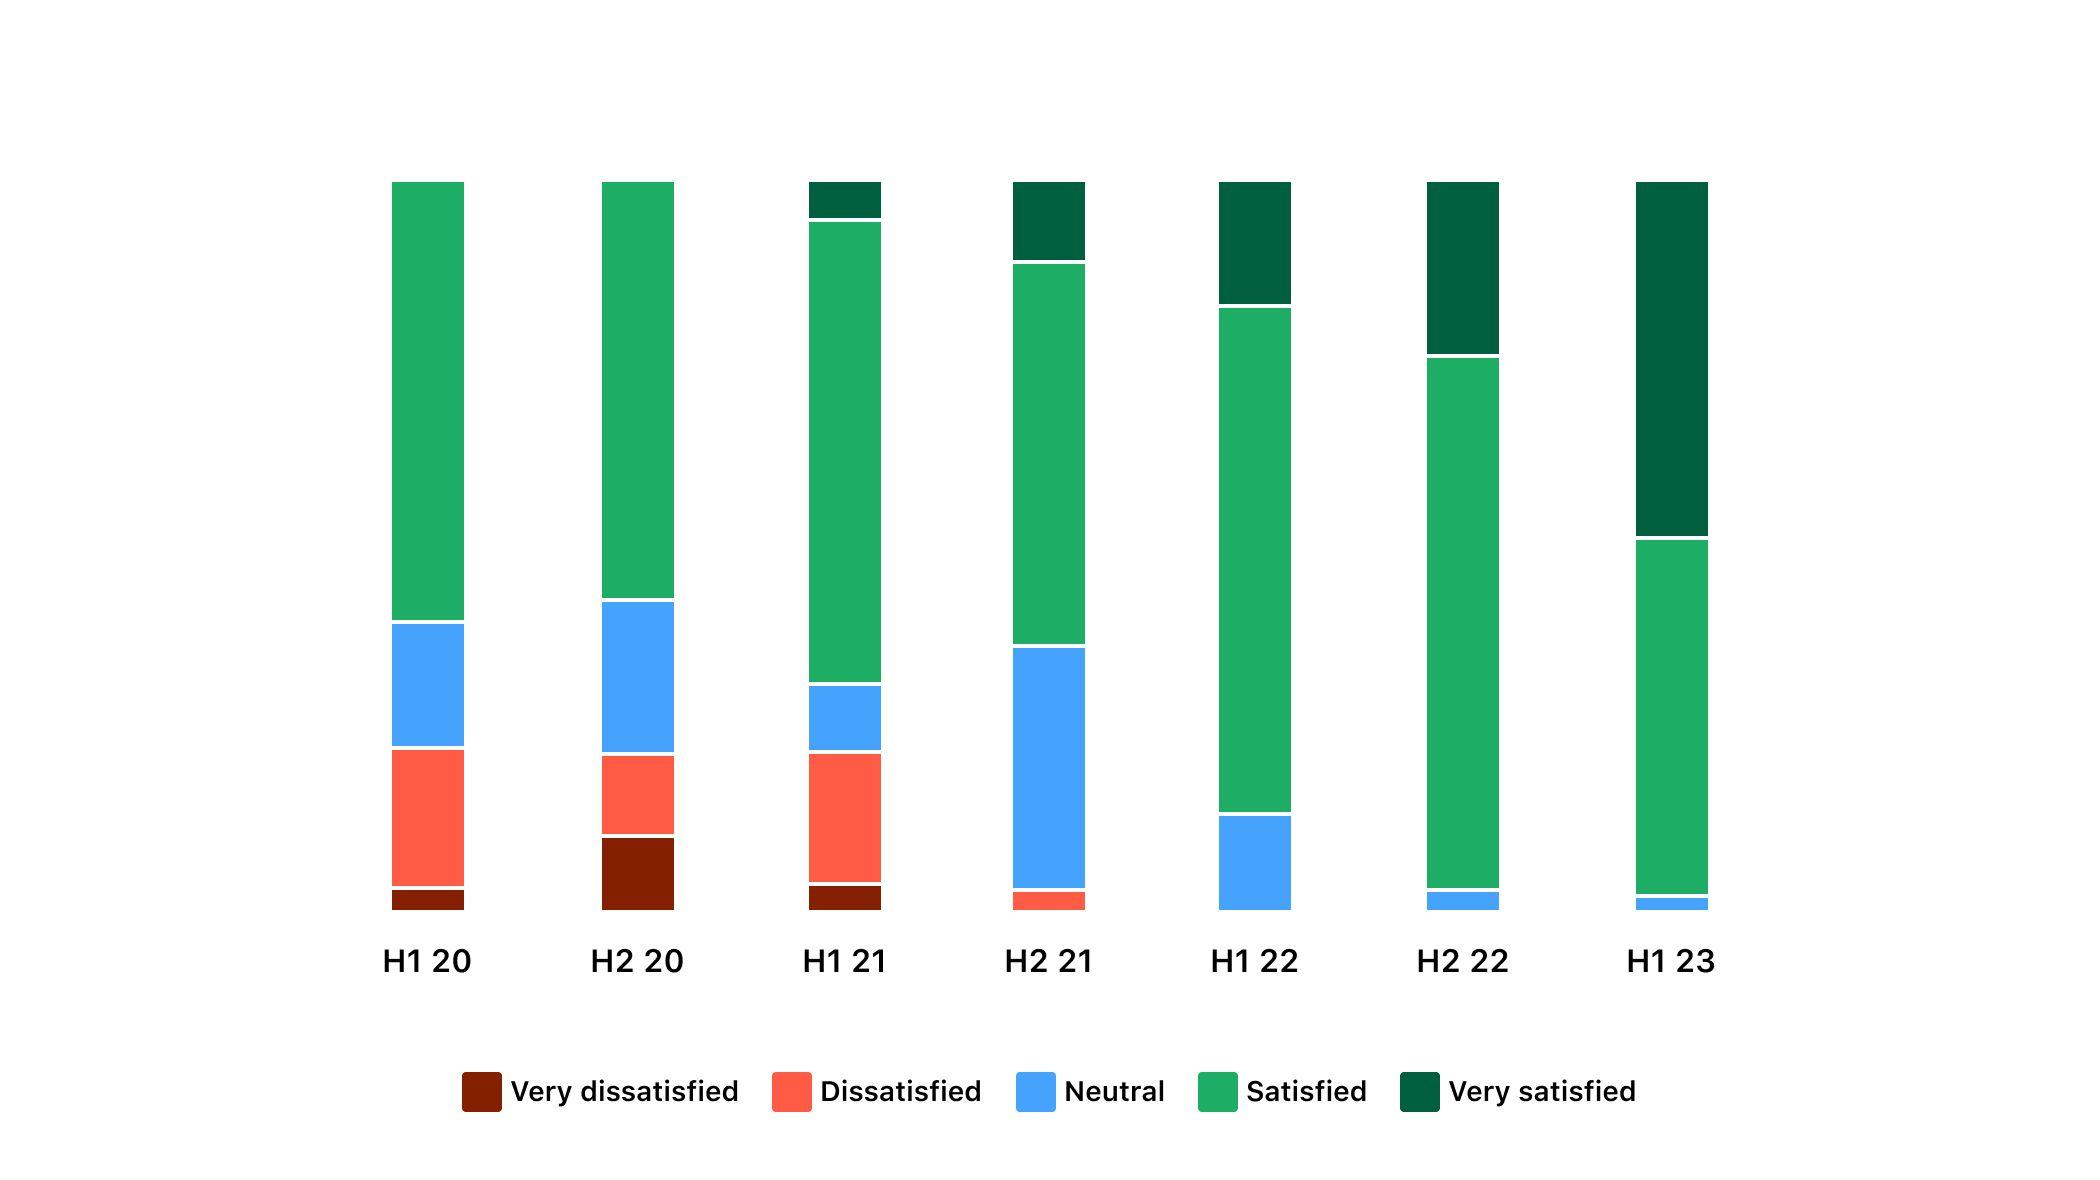
In the world of user-reported metrics, surveys are your best friend. Getting a measure of how your users feel or think about your design system is an excellent tool in your arsenal. Take Pinterest's Gestalt team — every half, they conduct a sentiment survey and publish the results in their newsletter. And they also happen to be one of the best cases of long-recorded data.
If you're on the fence about creating a completely custom survey, you can use more traditional options, like Net Promoter Score (NPS) or Rating surveys.
Talking to your team is a great way to understand how well users are adopting your design system. These won't give you exact numbers, but they will give you a good understanding of where they are and what's stopping them from full adoption.
In his article, Nathan Curtis, one of the leading design system experts, explains that you can use self-reporting by different buckets, like individual teams or products, to keep a scorecard.
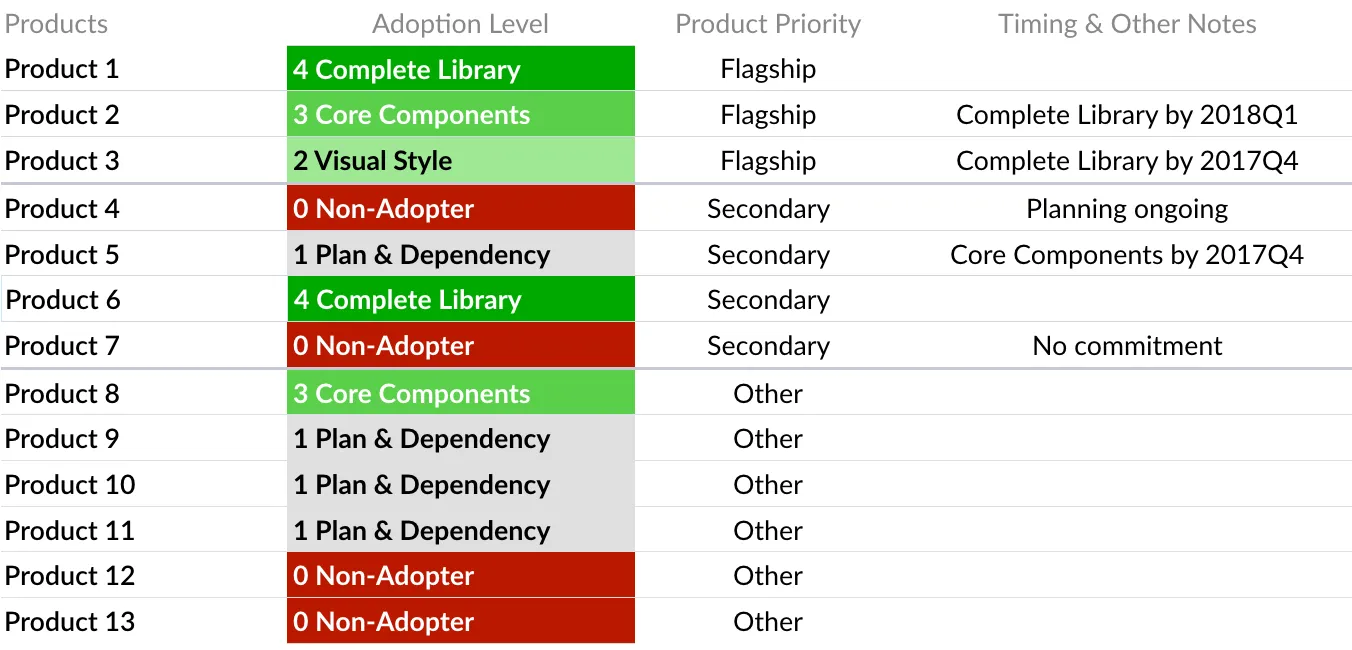
This practice can also be backed up by quantitative analytical metrics, and it's an excellent way to keep track of larger organizations and their adoption.
Back in our documentation panel, we asked industry experts how they measured their documentation. We compiled a simplified action item list from their insights to help you get the most out of your users.
“Rotating to different departments and you spend some more time with them, even if it's online, and you see how they use the documentation, what they lack.” - Romina Kavcic, leading independent design strategist, during the Design System Documentation is a Moving Target panel
You can't rely only on user-reported metrics to get a complete picture of your design system adoption. Analytics give you less biased and more reliable information to help you judge adoption much better.
There are three core pillars to any successful design system: design, documentation, and code. We will go over the different ways you can measure adoption through the three pillars. You can paint a more accurate picture the more data you collect, but if you’re resource-constrained, pick what works best for your team.
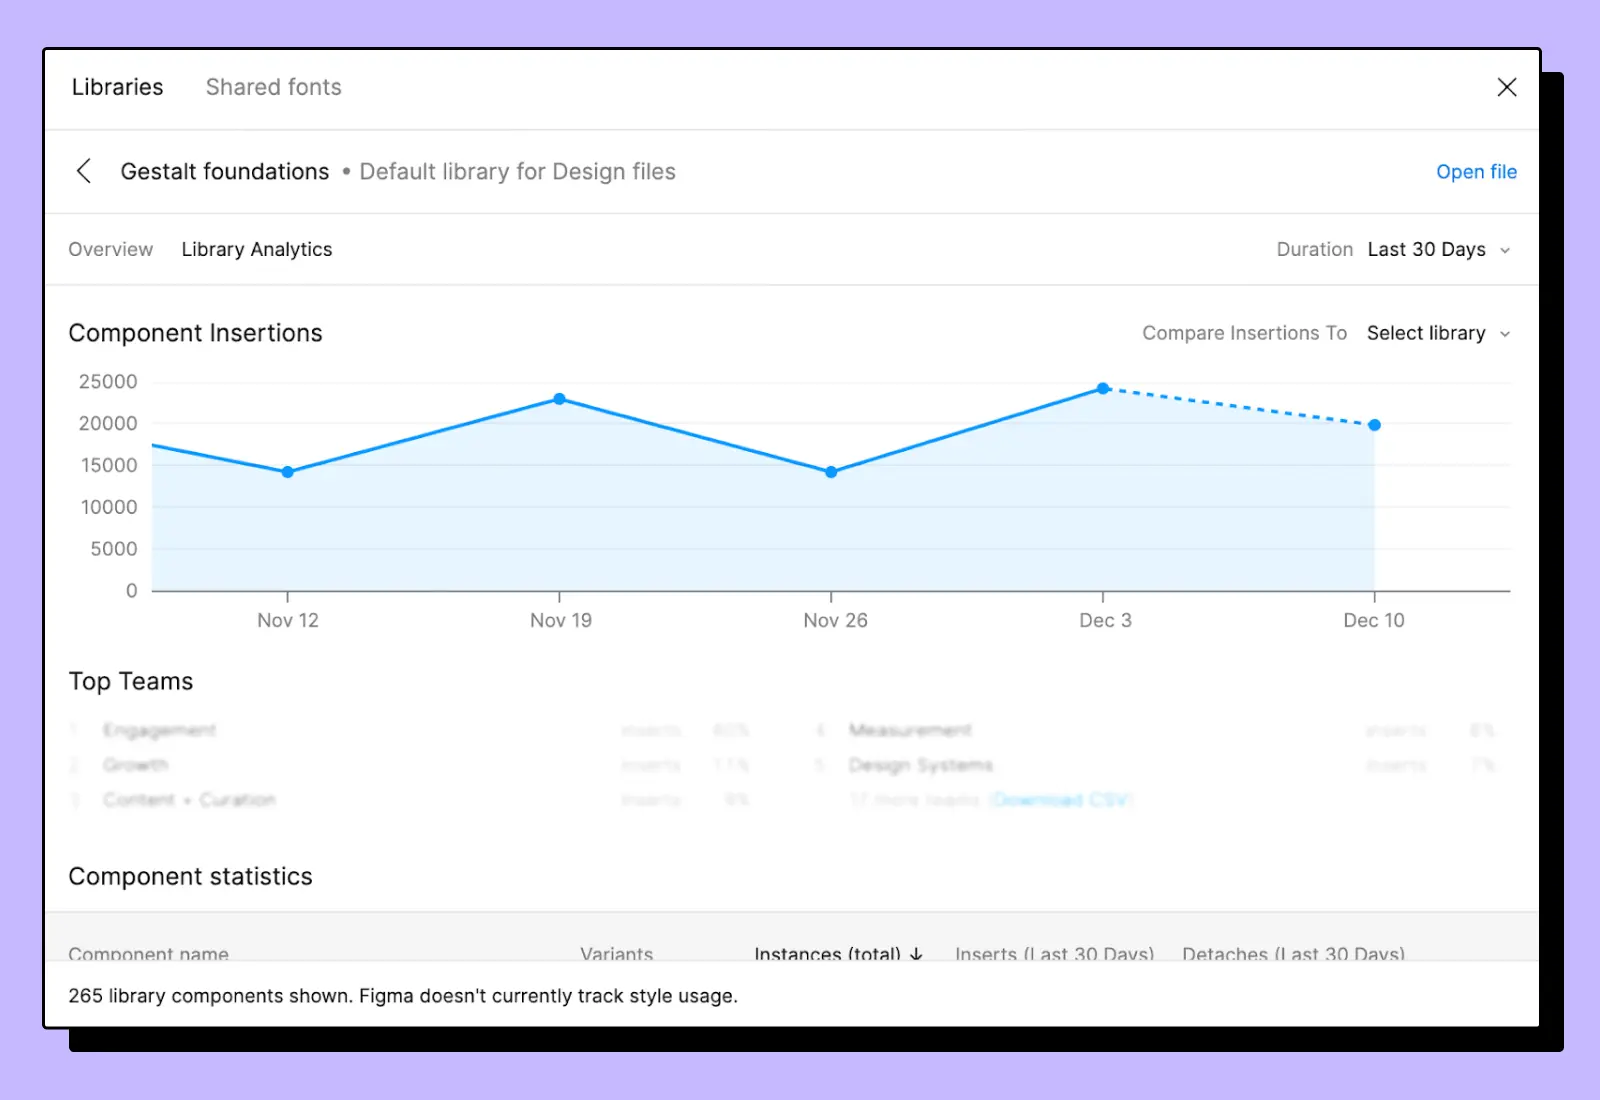
Whether your entire design system is built using Figma or you're using it as a component library, there's a lot you can track with their analytics.
Out of the box, you can find details on component libraries, including component insertions, team contributions and more statistics.
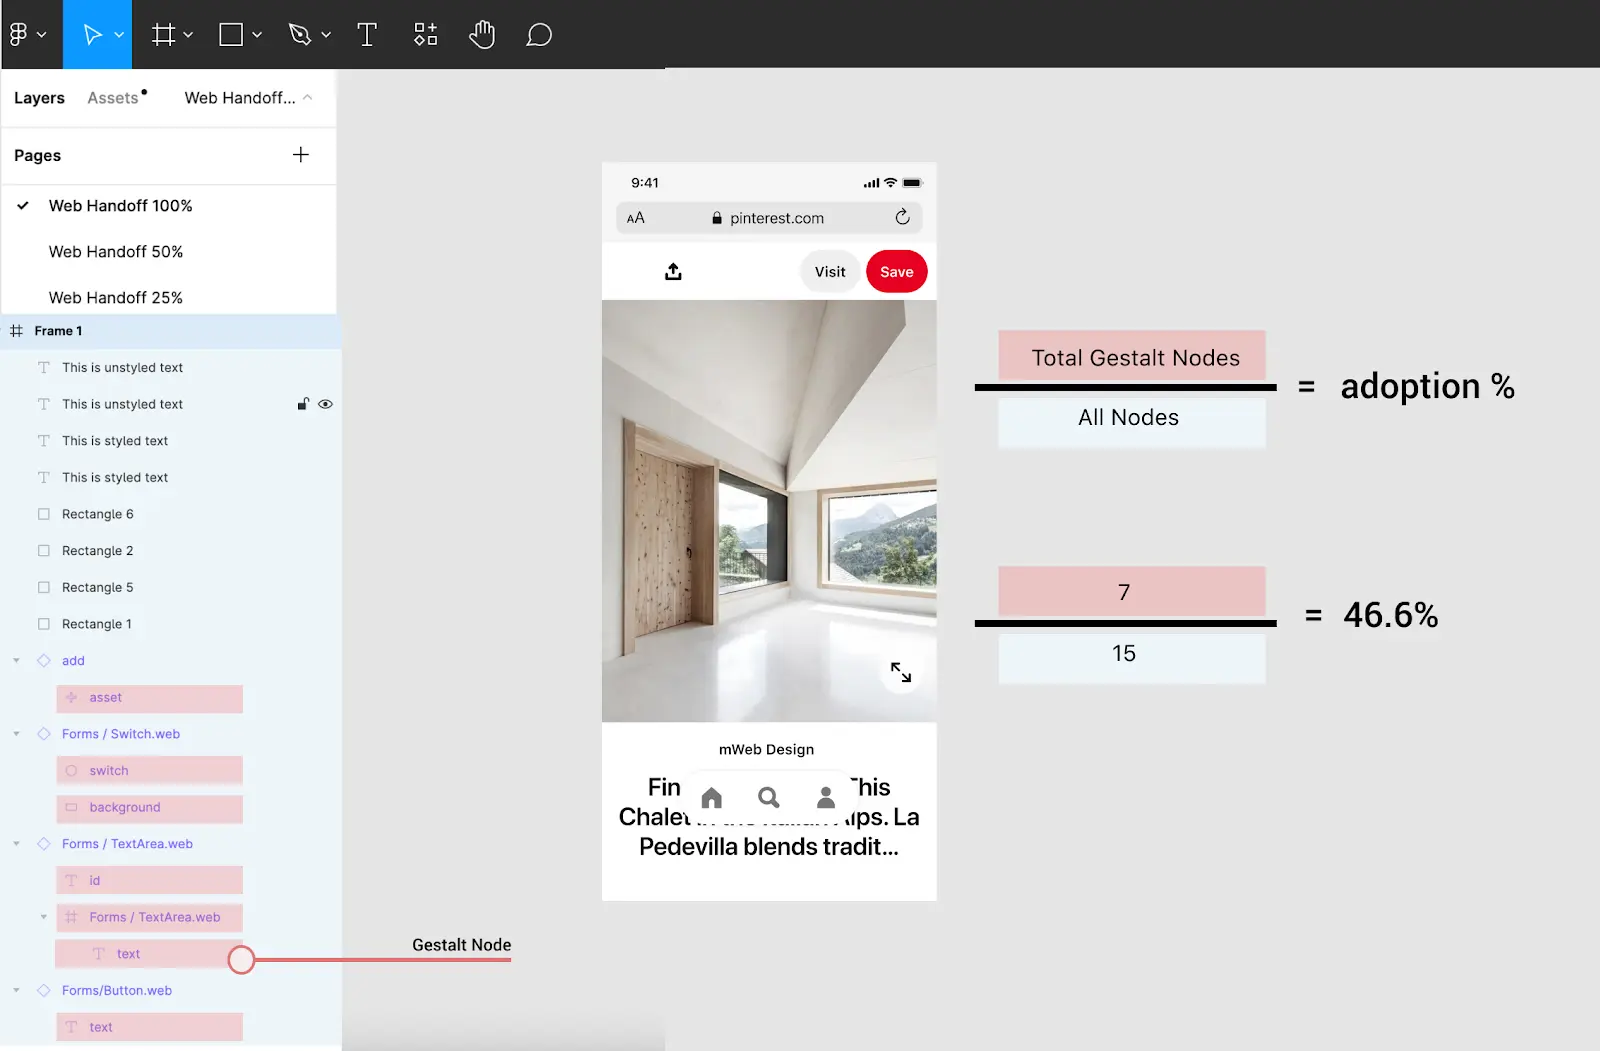
But as the Gestalt team puts it, this only tells you part of the story. You need to add a layer of context for the component insertions. For any given screen, you need to calculate the relative adoption, so the amount of design system components ÷ the total number of components.
You might be wondering, surely there's a more straightforward way to measure component usage? Well, that brings us to tracking components in code.
The design team at Productboard talked about how they were initially only tracking visual designs. They eventually reached the conclusion that visual measurement was hard to quantify. They felt it was great for areas of improvement but not for the design system as a whole. They ended up tracking component use in code to measure adoption as a primary metric and relegating visual tracking to a secondary metric. But how exactly do you track adoption using your code? Let's take a look.
Similar to design tracking, the way to track adoption in code is through component usage. By following a design system's guidelines, a component would have the same name in your code. The basic idea is that you parse your code for references to your components, and from that data, you can learn all about adoption. The process for this usually goes as follows:
Every organization is different, and the level of difficulty to do this will differ, but the idea remains the same. You might find inspiration from some of the successful implementations by various design system teams.
The Evergreen team went into a great deal of detail about how they created their adoption dashboard and how they reported on progress. They track three main metrics: global adoption, adoption week over week, and component usage.
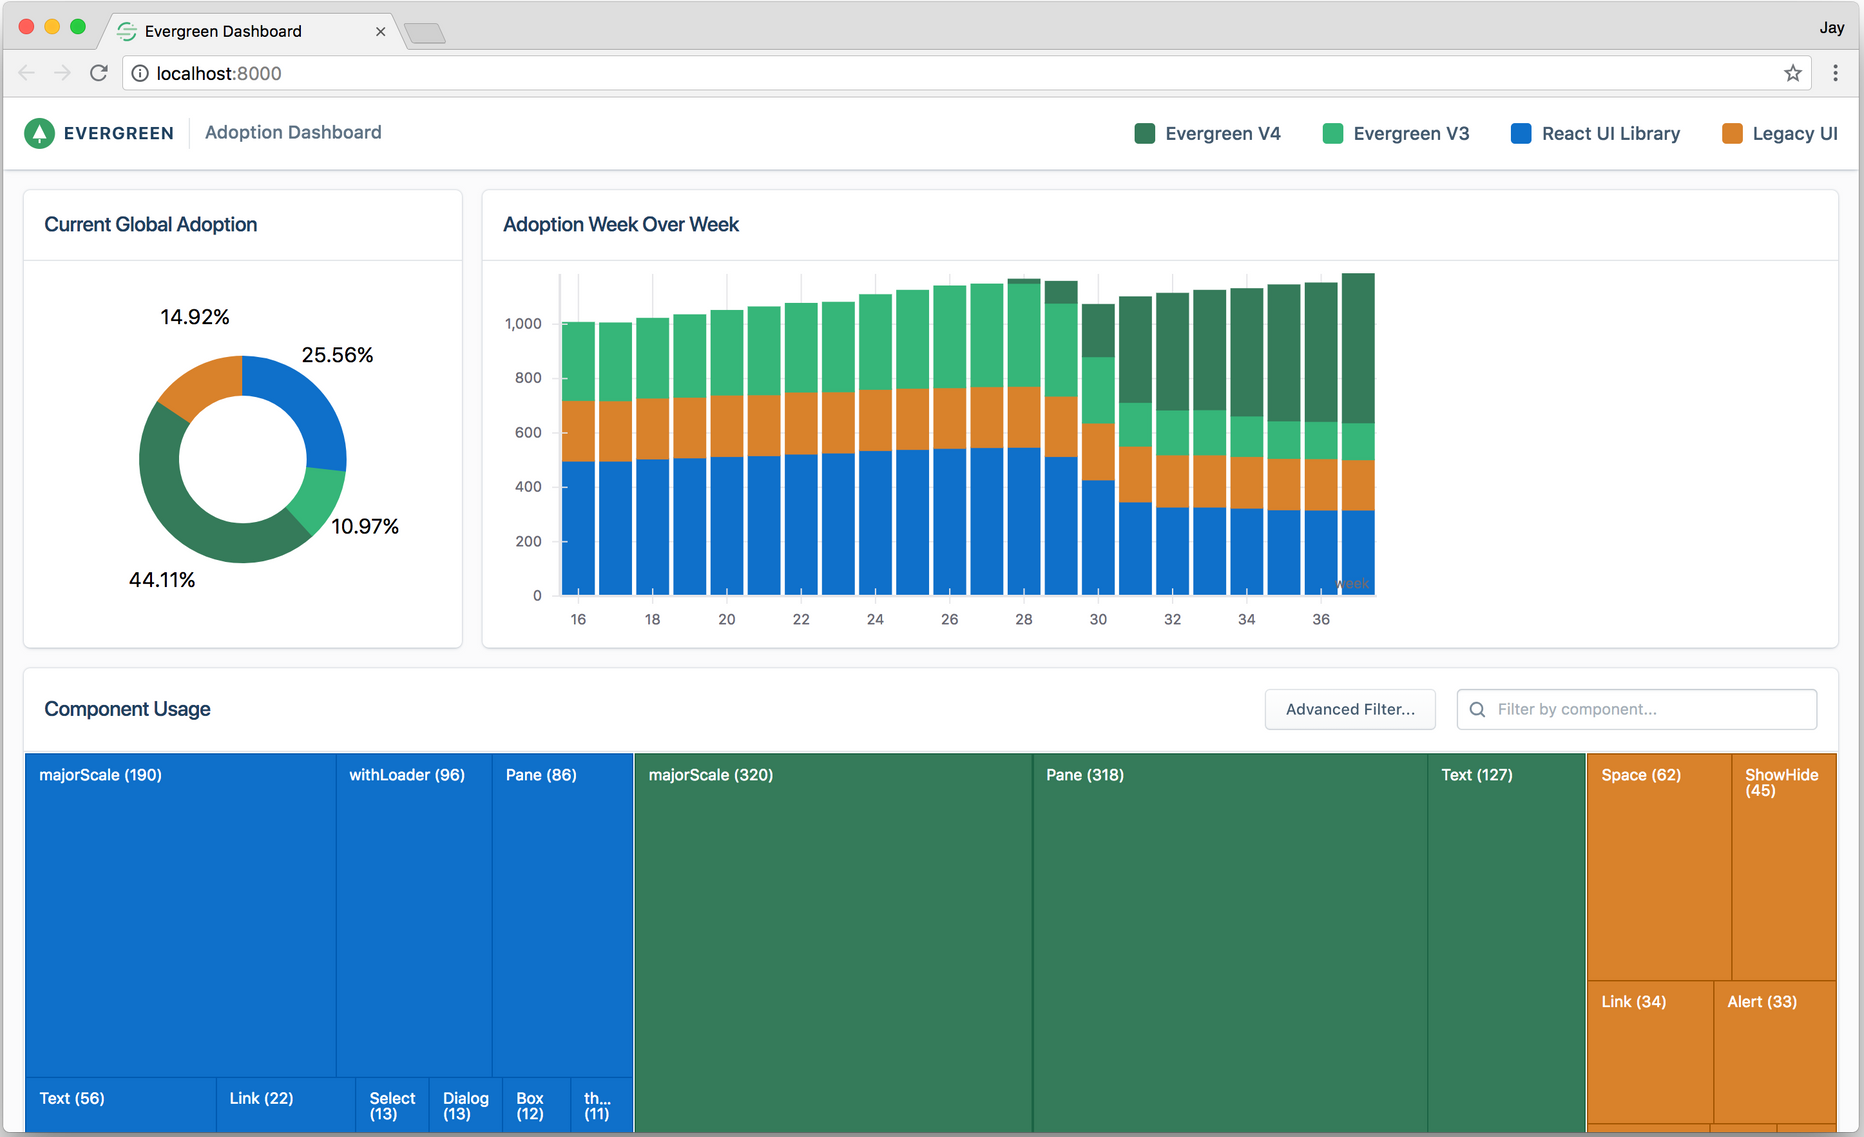
Check out their detailed rundown of how they measured adoption. It also includes their open-sourced tool to help you build out your own adoption dashboard.
If you're looking for more details on how you might extract your code and analyze it, the folks at Twillio have you covered. Read their full guide for more information.
Their report shows an easy-to-understand graph of Paste's adoption in the organization.

Another great source of inspiration is Vasco Borges's journey to measure the impact of the Cobalt design system. He goes into detail about their approach, method, and results.
To round off the different ways you can track adoption, you have documentation usage. The importance of a central source of truth for your design system cannot be overstated. And documentation sites, whether public or private, are the most popular and effective way to get your design system into the hands of users.
If you're curious about how you can document your design system easily, you can find more details in our article, How to Use Supernova for Design System Documentation.
Similar to any website, there are a set of metrics that can give you a strong idea of your reach, popularity, and what's resonating with your users. These metrics include:
There are many different tools you can use to track these metrics, like the usual suspects Google Analytics and Hotjar. In our next article, we'll go into more detail on how to use GA with Supernova to easily track your documentation site's analytics, so stay tuned for that.
Measuring the impact of anything can be tricky, but with these different methods, you can now better understand your design system's adoption. Be careful of falling into the trap of relying to much on numbers. In the end, all that you're tracking is data points, and it needs a combination of different data points as well as some context to really be helpful.
Have any different or interesting ways of measuring adoption? Reach out to us on Twitter we'd love to learn more and feature more voices from the industry. Otherwise, check out our next article in the series that goes into detail on how you can use Supernova to track your documentation usage with Google Analytics.
.png)

